Power, Privilege, and the Purse
Throughout this project, students were brought awareness of different privileges in America. They studied and discussed historical perspectives such as slavery and the Jim Crow era, education inequalities, wealth inequalities, gender inequalities, and the criminal justice system. After some well-rounded research, students created position papers answering whether the American Dream was real. In it, they were able to include graphs created using statistics based on their topic.
As students researched wealth inequality, they created their own financial plan that included retirement, short-term, and mid-term savings. In addition, they discussed political topics such as raising the minimum wage to a livable or wage and what that would look like.
As students researched wealth inequality, they created their own financial plan that included retirement, short-term, and mid-term savings. In addition, they discussed political topics such as raising the minimum wage to a livable or wage and what that would look like.
Process
Students were given numerous articles with a variety of perspectives and watched documentaries on the different topics (slavery and the Jim Crow era, education inequalities, wealth inequalities, gender inequalities, and the criminal justice system). After each topic, students discussed their ideas whether in large or small groups and were encouraged to defend their own opinion which often led to heated discussions.
In math, students learned about taxes, loans, grants and scholarships, and how to save during their career. This experience was a unique one because students were able to see themselves financially post graduation. It was inspirational comparing how well off you would be with an education compared to living with minimum wage.
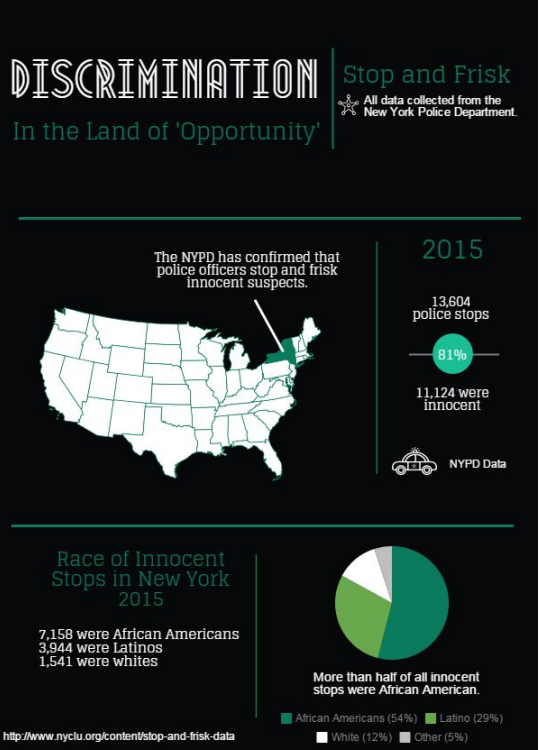
To compliment the topics they were reviewing in humanities, students created infographics showing extreme statistics. I did my topic on the criminal justice system. For my infographic, I used data from the New York Police Department that showed how many innocent citizens were stopped and the race for each one. Astonishing, more than half all of innocent stops in New York were of African Americans.
Studying the criminal justice was tricky. With so many sensitive cases such as Ferguson and racial bias, one had to be careful of provoking any offensive arguments. We needed to be aware of both sides so we used articles that were given in class which showed both perspectives. However, with adequate research, we as a panel were able to maintain a professional environment and expose our ideas with strong evidence to help support us.
The part I enjoyed the most was listening to other people's panels, spoken words, ted talks, and plays. The variety of things kept our exhibition interesting. Guests would have probably been bored if we all were talking about the same thing.
In math, students learned about taxes, loans, grants and scholarships, and how to save during their career. This experience was a unique one because students were able to see themselves financially post graduation. It was inspirational comparing how well off you would be with an education compared to living with minimum wage.
To compliment the topics they were reviewing in humanities, students created infographics showing extreme statistics. I did my topic on the criminal justice system. For my infographic, I used data from the New York Police Department that showed how many innocent citizens were stopped and the race for each one. Astonishing, more than half all of innocent stops in New York were of African Americans.
Studying the criminal justice was tricky. With so many sensitive cases such as Ferguson and racial bias, one had to be careful of provoking any offensive arguments. We needed to be aware of both sides so we used articles that were given in class which showed both perspectives. However, with adequate research, we as a panel were able to maintain a professional environment and expose our ideas with strong evidence to help support us.
The part I enjoyed the most was listening to other people's panels, spoken words, ted talks, and plays. The variety of things kept our exhibition interesting. Guests would have probably been bored if we all were talking about the same thing.
Criminal Justice Infographic: Stop and Frisk Data in New York
Math Learning
In math, I was exposed to a range of concepts that are needed in real world situations. I found it intriguing to use personal life aspirations as a way of calculating one's budgeting, taxes, and savings plan. I was exposed to the correct way of creating savings accounts to make sure you're well off with commitments that are rather pricey, especially retirement. I had never been exposed to these life necessities in depth and am glad I was able to start understanding it. Exponential functions were used to see how your savings would increase with interest. This was a neat way to connect exponential functions to something we would actually remember.
For my infographic, I used the Statistical Problem Solving Process to come up with a question on how African Americans were treated compared to whites and used that to look for data. Once I found data from the New York Police Department, I gathered all the numbers and changed them into percentages to put onto a pie chart for a better visual. This turned a bunch of numbers into a striking piece that conveyed how drastically different African Americans are treated compared to whites.
In general, we've been learning new formulas that may sound a little more "traditional" than the math we use at High Tech such as standard deviation, and statistics but we've also started to really dig into topics we've covered before such as graphs (box plots, histograms, pie charts, etc.), and logarithms. For example, I knew that logarithms were an inverse of exponents but now we discovered how to use it and what it is used for such as interest rates.
The biggest takeaway I had in this project for math was without a doubt was the ideal minimum wage. It was stressful enough just coming up with a budget plan to live with an ideal minimum wage (mine was $15) that I can't even imagine how actual people are able to live their life with the actual minimum. To me, it really highlighted the importance of an education.
Humanities Learning
I am still in awe realizing that so many people come to the US for a better life yet are treated so inferior compared to natural-born Americans and are limited from so many opportunities. They do the work that the Americans don't want yet it is the Americans who are the homeless claiming to be seeking a job even though they reject any that pay minimum wage or does not offer benefits.
There is just still so much inequality in America still. I really do not understand how we can be the land of opportunity like this. With bias in the criminal justice system, education inequalities for minorities, and such a large wealth inequality ratio, America is honestly not the land of where everyone is treated the same.
The only thing I honestly gained was fuel to my claim that America is not the land of equality. Both Latinos and African Americans are still being treated unfairly as they once were in history. We are still living in the past, we haven't gained much accomplishments that will help minorities.
"Mind the Gap" Exhibition
All of this learning was portrayed in an exhibition at the Vista Community Clinic. Inside there were different panels going on about different topics related to the American Dream. Outside were some interactives that tied in to what the topics were about. As mentioned before, I was a panelist in the criminal justice panel. The criminal justice panel spent most of the time talking about police bias and attorney bias since those were what were split in the opening statements. Our guest panelist was a defense attorney who we had never met so it was not foreshadowed what he would bring to the table. But I feel like all of the panelists were well equipped to answer anything that would come their way. I know that I sure was. For the first mock panel, I was very nervous. I didn't debate much in fear that I might be further questioned but for the exhibition night, I decided to go for it. I felt prepared and had some well rounded research at hand. The panel got heated and went in depths into the questions which hopefully provided more information for the audience. Overall, it was a successful and informative night!
